Introduction
In order to connect new customers to the gas distribution system, gas utilities subsidize the extension of their pipelines by raising rates for existing customers. The size of these subsidies is set by regulators under rules called Line Extension Allowances (LEAs).
But how much are Illinois ratepayers paying to subsidize the expansion of the natural gas system under LEAs? Could they be paying too much? If so, what alternatives are available?
Any expansion of the gas system conflicts with Illinois’s decarbonization goals. In September 2021, Governor Pritzker signed into law the Climate and Equitable Jobs Act (CEJA) – one of the nation’s most ambitious state climate laws. CEJA commits Illinois to a 100% clean energy future by 2050. These emission targets are incompatible with a growing gas system, which
itself risks increasing inequitable energy burdens.
This memo presents the most complete data to date on how many ratepayer dollars Illinois’ three major utilities (Nicor, Peoples Gas, and Ameren) are spending on these gas system expansion subsidies. We present the most complete view of the data available, which is incomplete because these companies either cannot or choose not to make the full information on their LEA-subsidized spending available to the public.
Executive Summary
Illinois’s three major gas utilities spent an estimated $113.8 million in 2022 subsidizing new gas connections under Line Extension Allowances.
Nicor’s average subsidy per new main extension was $15,202 in 2023. During the same period, Peoples Gas ratepayers paid $11,784 per new single-family connection.
In 2022, Nicor’s ratepayers bore approximately $65.7 million in LEA costs. Peoples Gas ratepayers paid $26.7 million and we estimate that Ameren ratepayers paid $21.3 million.
Eight states have already acted. California, Colorado, Washington, Oregon, Minnesota, Maryland, Massachusetts, and New York have taken substantive action to reduce or eliminate gas LEAs, with estimated aggregate savings of $750 million per year.
The Illinois Commerce Commission can act to effectively eliminate main & service LEAs statewide. The rules governing LEAs are regulatory, not legislative. This means the ICC can act on its own initiative without the need for legislation to directly address this issue.
Utilities do not consistently track or disclose LEA spending. No utility voluntarily published this data. Instead, we extracted it from discovery responses in rate case proceedings before the Illinois Commerce Commission (ICC). No utility reports a single, standardized LEA spending figure, and some have explicitly objected to requests for LEA data.
Background
What are Line Extension Allowances?
Each year, Illinois gas utilities connect thousands of new customers to the state’s gas distribution system.
Between 2018 and 2025, these utilities built hundreds of miles of mains (the gas distribution lines that run through streets and neighborhoods). They also built between 27,500 and 51,000 new service lines (the smaller pipes that branch off the main to connect an individual building) each year. While some of these connections are replacements for existing pipes, we calculate that net service connections still ranged between 3,000 and 6,000 per year.
Some of the customers serviced by these new connections are constructing new buildings on existing sites already served by the gas network. Others are newly-built or existing buildings that are being connected to the network for the first time. In either case, the connections effectively grow the utilities’ pipeline network (and thus, their emissions).
The customers receiving service lines don’t usually pay for this expansion work themselves. Instead, most of the cost is covered by subsidies set by regulators through rules called Line Extension Allowances (LEAs). Those subsidies are paid for by existing gas customers through increases to their monthly bills
Specifically, in Illinois, new customers are not required to pay for the first 100 to 400 feet of a main extension, or for the first 60 feet of a new service line to connect their building to the main. The costs of that construction are passed through to the existing ratepayers. 1
1 These thresholds are codified in Title 83, Part 501.600 of the Illinois Administrative Code (for mains) as well as in individual ICC-approved tariff schedules (for service lines). A tariff is a utility’s ICC-approved schedule of rates and service terms. Unlike main extensions, which are governed by a statewide administrative rule, service line allowances are set utility-by-utility in each company’s tariff.
2 Bill SB2269, introduced in the Illinois General Assembly in 2025, would have required gas utilities to charge customers for the full incremental cost of new development and growth their connection creates. § 9-228.5 states: “Gas main and gas service extension policies shall be based on the principle that the full incremental cost associated with new development and growth shall be borne by the customers that cause those incremental costs.” See § 9-228.5. (SB2269 2- 7- 2025)
In effect, LEAs hide the true cost of heating a building with natural gas from the developers and building owners who benefit from the new connections. Because existing customers pay for the connection, gas heating seems cheaper and more attractive than it actually is. That creates a market distortion which makes cleaner alternatives to gas heating (such as heat pumps) seem less competitive.2
The problem is statewide. While Illinois law only requires gas utilities to provide LEA subsidies to urban customers, most utilities also offer them to rural customers, and the ICC currently approves this practice. 3
3 Title 83, Part 501.600 of the Illinois Administrative Code mandates free main extension footage for urban customers. The companion provision, Section 501.610, governs rural extensions through a deposit-based mechanism rather than a free footage mandate. However, Ameren Illinois (which services much of rural Illinois) voluntarily provides 400 feet of free main to both urban and rural new customers under an agreement with ICC Staff (ICC Docket No. 03-0767, Appendix to Final Order, Jan. 25, 2006). The ICC currently approves this practice. (iccTitle83Part2006?)
How do LEAs affect current customers’ bills?
When a utility company builds a new main extension or service line, the cost of that infrastructure is added to the utility’s rate base. The rate base is the total value of the company’s assets, which regulators use to set the amount of profit that the utility can earn for its shareholders.
So when these companies build a new pipe under an LEA, existing customers pay for the cost of the construction plus the utility’s guaranteed profit margin on that investment. And those payments are recouped from gas customers,
through their bills, over the entire life of the pipe. Gas infrastructure remains in the company’s rate base for its full depreciation life (typically 40–60 years in Illinois). That means customers keep paying for the new connection, plus company profits, for decades after the infrastructure is built.
Why are states revisiting LEA policies?
Historically, LEAs were established to grow the gas distribution system, allowing utilities to capitalize on economies of scale. More customers meant cheaper service for everyone. LEAs made it cheaper to connect new customers to the gas network, and that made sense when customers could be assumed to stay in the system indefinitely. A growing customer base also meant the costs associated with LEAs would be recouped through increased revenue over time, making them even more attractive.4
4 See Vu and Bagdanov, “The End of Gas System Subsidies,” Building Decarbonization Coalition, August 2025. (Vu and Bagdanov 2025)
But that’s changing.
Today, rising gas bills and broader awareness of the environmental damage associated with natural gas emissions, from both leaks and combustion, are leading regulators to reevaluate the role of LEAs.
As states progress towards their climate goals, they are increasingly looking to electrify buildings and transportation systems in order to reduce emissions. Continued expansion of the natural gas system not only runs counter to those reduction targets, but also encourages additional investment in infrastructure that may no longer be needed as alternatives to gas heating become more widely available.
Unfortunately, the growing adoption of cost-effective electric alternatives to gas can create pieces of gas infrastructure (such as pipeline networks) that are rendered obsolete or uneconomic before the end of their predicted useful life. So as some customers shift away from natural gas, a shrinking pool of ratepayers would be responsible for paying off investments in infrastructure they no longer use.
Worse still, low-income ratepayers are often those who are least able to electrify their homes and businesses. Renters have little say in how their landlord chooses to heat their home, and residents of much older buildings face increased costs for retrofitting their homes with electric alternatives.
Eight states lead the way on LEA reform
California, Colorado, Washington, Oregon, Minnesota, Maryland, Massachusetts, and New York have all taken measures to reduce or completely end gas LEAs. All three states (California, Colorado, and New York) that eliminated LEAs entirely have saved their ratepayers an estimated $100–$200 million per year. 5
5 Rocky Mountain Institute (RMI) estimates that each of California, Colorado, and New York saves ratepayers $100–$200 million per year following LEA elimination. (Henchen and Joe Dammel 2025)
6 Washington: Avista and Puget Sound Energy eliminated gas LEAs effective January 2025; Cascade Natural Gas by March 2027. Oregon: Avista and NW Natural required to phase out LEAs by 2027. (Vu and Bagdanov 2025)
Washington’s and Oregon’s utility commissions have required that their states’ largest gas utilities eliminate all LEAs, with some utilities meeting deadlines as early as January 2025 and the remainder scheduled to follow by 2027. 6
Reform efforts in Minnesota, Maryland, and Massachusetts have been more modest. So far they’ve been limited to reducing the size of LEAs, draft regulations and proposals, and studies of current LEA policies. But in all three cases, state regulators have made it clear that they have serious concerns about the climate effects and long-term viability of LEAs. 7
7 Minnesota’s two largest gas utilities reduced per-connection allowances through rate case settlements in 2022 and 2023. Maryland PSC issued Order No. 91683 in June 2025 directing staff to draft LEA reform regulations. Massachusetts DPU issued an order in August 2025 signaling intent to eliminate allowances. (Vu and Bagdanov 2025)
8 PG&E data reported in (Henchen and Joe Dammel 2025). The 72%/91% figures reflect 2023 new extension requests following California’s LEA reform. The 8–9% baseline reflects the share of existing residential customers on all-electric service prior to reform.
There’s also early evidence that eliminating LEAs can shift the market away from gas. In 2023, California’s largest combined gas and electric utility reported that 72 percent of new residential and 91 percent of new non-residential extension requests were for electric service only. Prior to the state’s LEA reform, only 8 to 9 percent of existing residential customers opted for electric service only. 8
What can the ICC do about LEAs in Illinois?
The ICC has already begun a major review of the state’s LEA policies in order to determine what role, if any, these subsidies should play in Illinois’s future energy system.
In November 2023, the ICC’s Final Orders in the Nicor, Ameren, Peoples Gas, and North Shore Gas rate cases directed the commencement of a Future of Gas proceeding to “explore issues tied to decarbonization of the gas system.” The Commission formally launched that proceeding in March 2024 (Docket No. 24-0158). LEAs and their alternatives were explicitly identified as issues of concern.9 ICC staff, working in conjunction with an independent facilitator, are due to produce a report on their findings along with recommendations for action in 2026. If the ICC decided to act, it could do so swiftly, effectively, and without legislative deliberation. Specifically, it could use two main regulatory mechanisms to address LEAs:
9 Illinois Commerce Commission, Future of Gas Proceeding, Docket No. 24-0158, launched March 2024. (iccFutureGasProceeding2024?)
10 “Rulemaking proceeding” refers to the formal process by which the ICC adopts, amends, or repeals administrative rules. This process involves public notice, comment periods, and commission votes, but does not require action by the General Assembly.
Main extensions are governed by Title 83, Part 501.600 of the Illinois Administrative Code. That regulation mandates that gas utilities provide free main extension footage to new customers. The ICC can repeal this rule through a rulemaking proceeding that doesn’t require legislation. 10
Service line extensions are governed differently. Utilities recover service line costs by including them in their rate base during rate cases. The ICC can simply disallow this inclusion in any future rate cases. 11
11 “Rate cases” are the periodic proceedings where utilities ask the ICC to let them adjust the rates they charge customers.
Findings
Illinois’s three major gas utilities – Nicor Gas, Peoples Gas, and Ameren Illinois Gas – maintain and/or provide limited information on what they spend on LEA projects. Nevertheless, we collected a mix of historical and forecasted spending data from ICC rate cases — specifically, Docket 23-0066 (Nicor Gas), Docket 23-0068 and 23-0069 (Peoples Gas), and Docket 23-0067 and 25-0084 (Ameren Illinois Gas).12 We combined these with our best estimates for missing data in order to give as full a picture as possible of just how much ratepayers are subsidizing new gas connections.
12 See ICC Docket 23-0066 (Nicor Gas PIO Exhibit 12), ICC Docket 23-0068 and 23-0069 (Peoples Gas), and ICC Docket 23-0067 and 25-0084 (Ameren Illinois Gas). No utility voluntarily publishes this data. (Northern Illinois Gas Company 2023; Peoples Gas 2023a; Kilhoffer 2023)
How much are LEAs costing Illinois ratepayers?
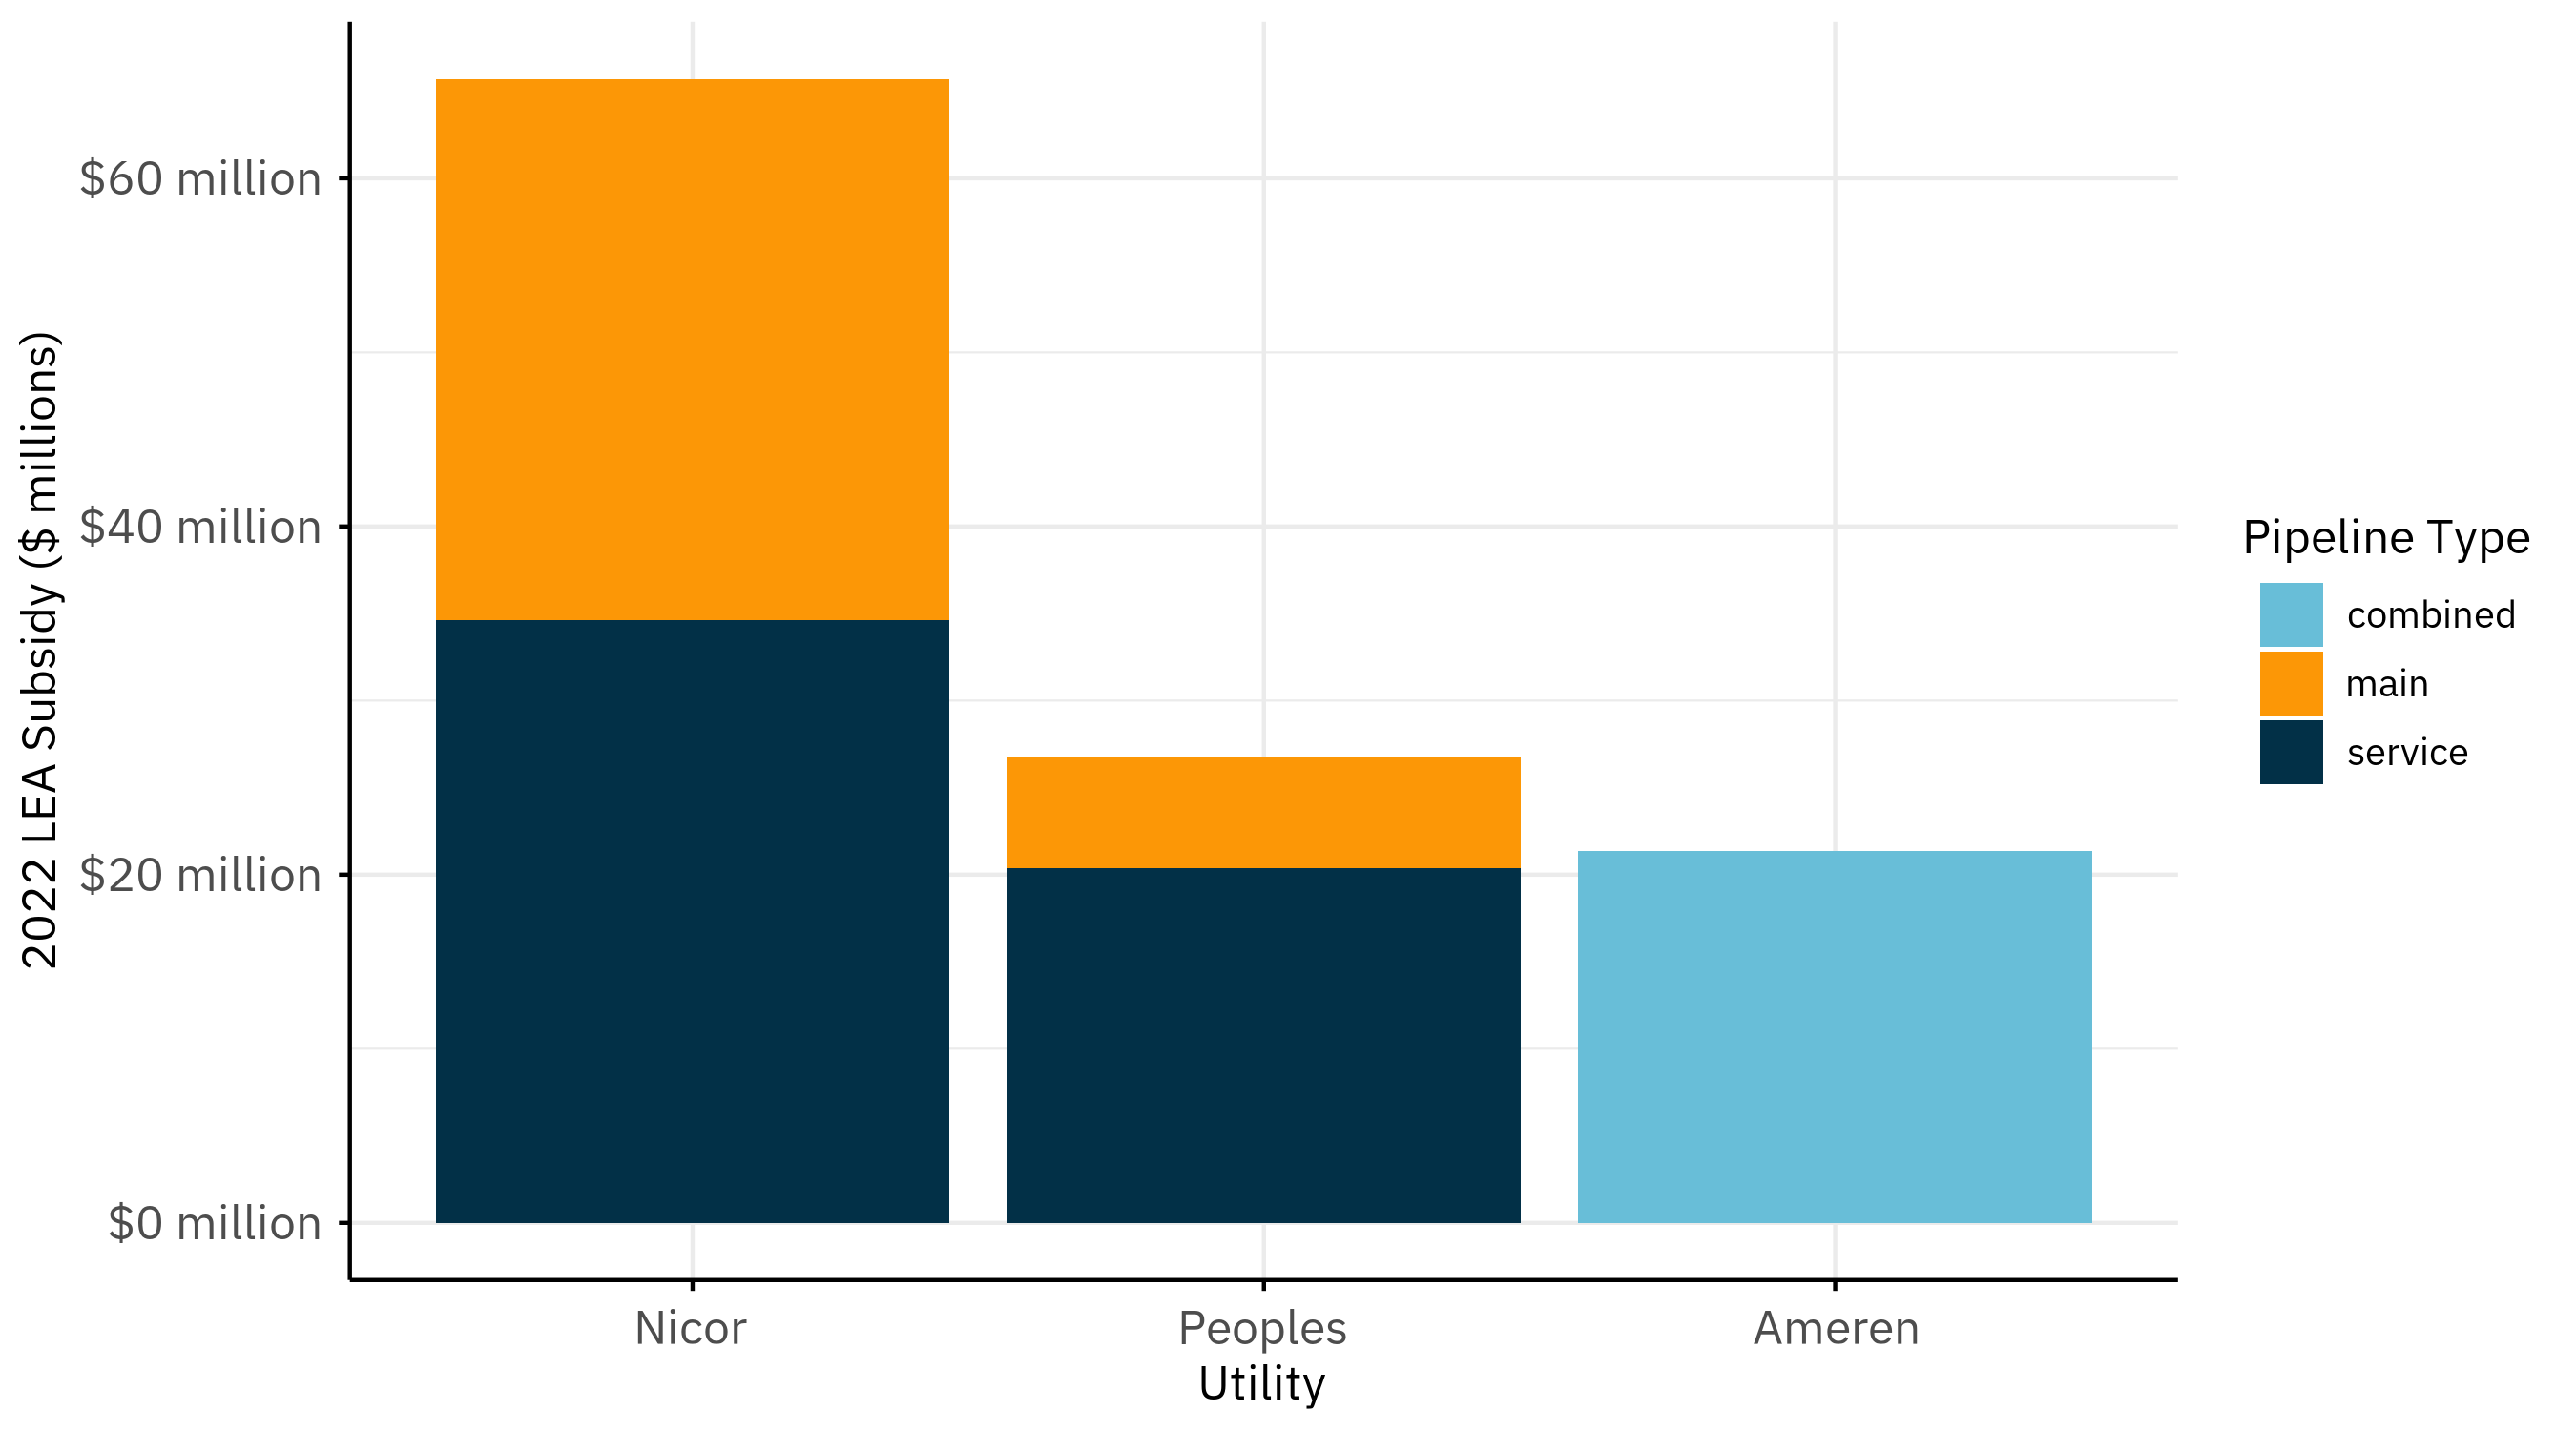
In 2022, the last year for which data is available across all three utilities, existing gas customers in Illinois paid an estimated total of $113.8 million on LEA subsidies. That amount combines main extension and service line spending, net of customer contributions, for Nicor Gas, Peoples Gas, and Ameren Illinois Gas.
| Utility | Mains (net of customer contributions) | Service lines | Total |
|---|---|---|---|
| Nicor Gas | $31,080,414 | $34,624,181 | $65,704,595 |
| Peoples Gas | $6,401,127 | $20,348,036 | $26,749,163 |
| Ameren Illinois Gas | $21,349,683 (combined) | — | $21,349,683 |
| Total | $113,803,441 |
13 Nicor main and service costs: ICC Docket 23-0066, PIO Exhibit 12, p. 33 (main gross), p. 33 (service gross), p. 34 (CIAC). Peoples Gas main and service costs: ICC Docket 23-0068, PIO Exhibit 12, p. 36 (mains), p. 36 (service). Peoples main figures explicitly net of customer contributions; same treatment assumed for service lines as no separate CIAC is disclosed. Ameren SWO C3231: ICC Docket 23-0067, PIO Exhibit 12, p. 13. (Northern Illinois Gas Company 2023; Peoples Gas 2023a; Kilhoffer 2023)
Nicor Gas accounts for more than half of total statewide LEA spending, with Peoples Gas and Ameren Illinois Gas making up the remainder — a split visible both by utility and by pipeline type (Figure 1).
Once more, this estimate is an approximation — see the appendix for a full discussion of data limitations and estimation methodology.14
14 In brief: Ameren does not report LEA spending as a separate line item, so its figure may include costs beyond traditional line extensions. Peoples Gas’s rate cases do not indicate whether service line spending is net of customer contributions (CIAC); we assume the same net treatment as its main extension figures.
How much does Nicor Gas spend on LEAs?
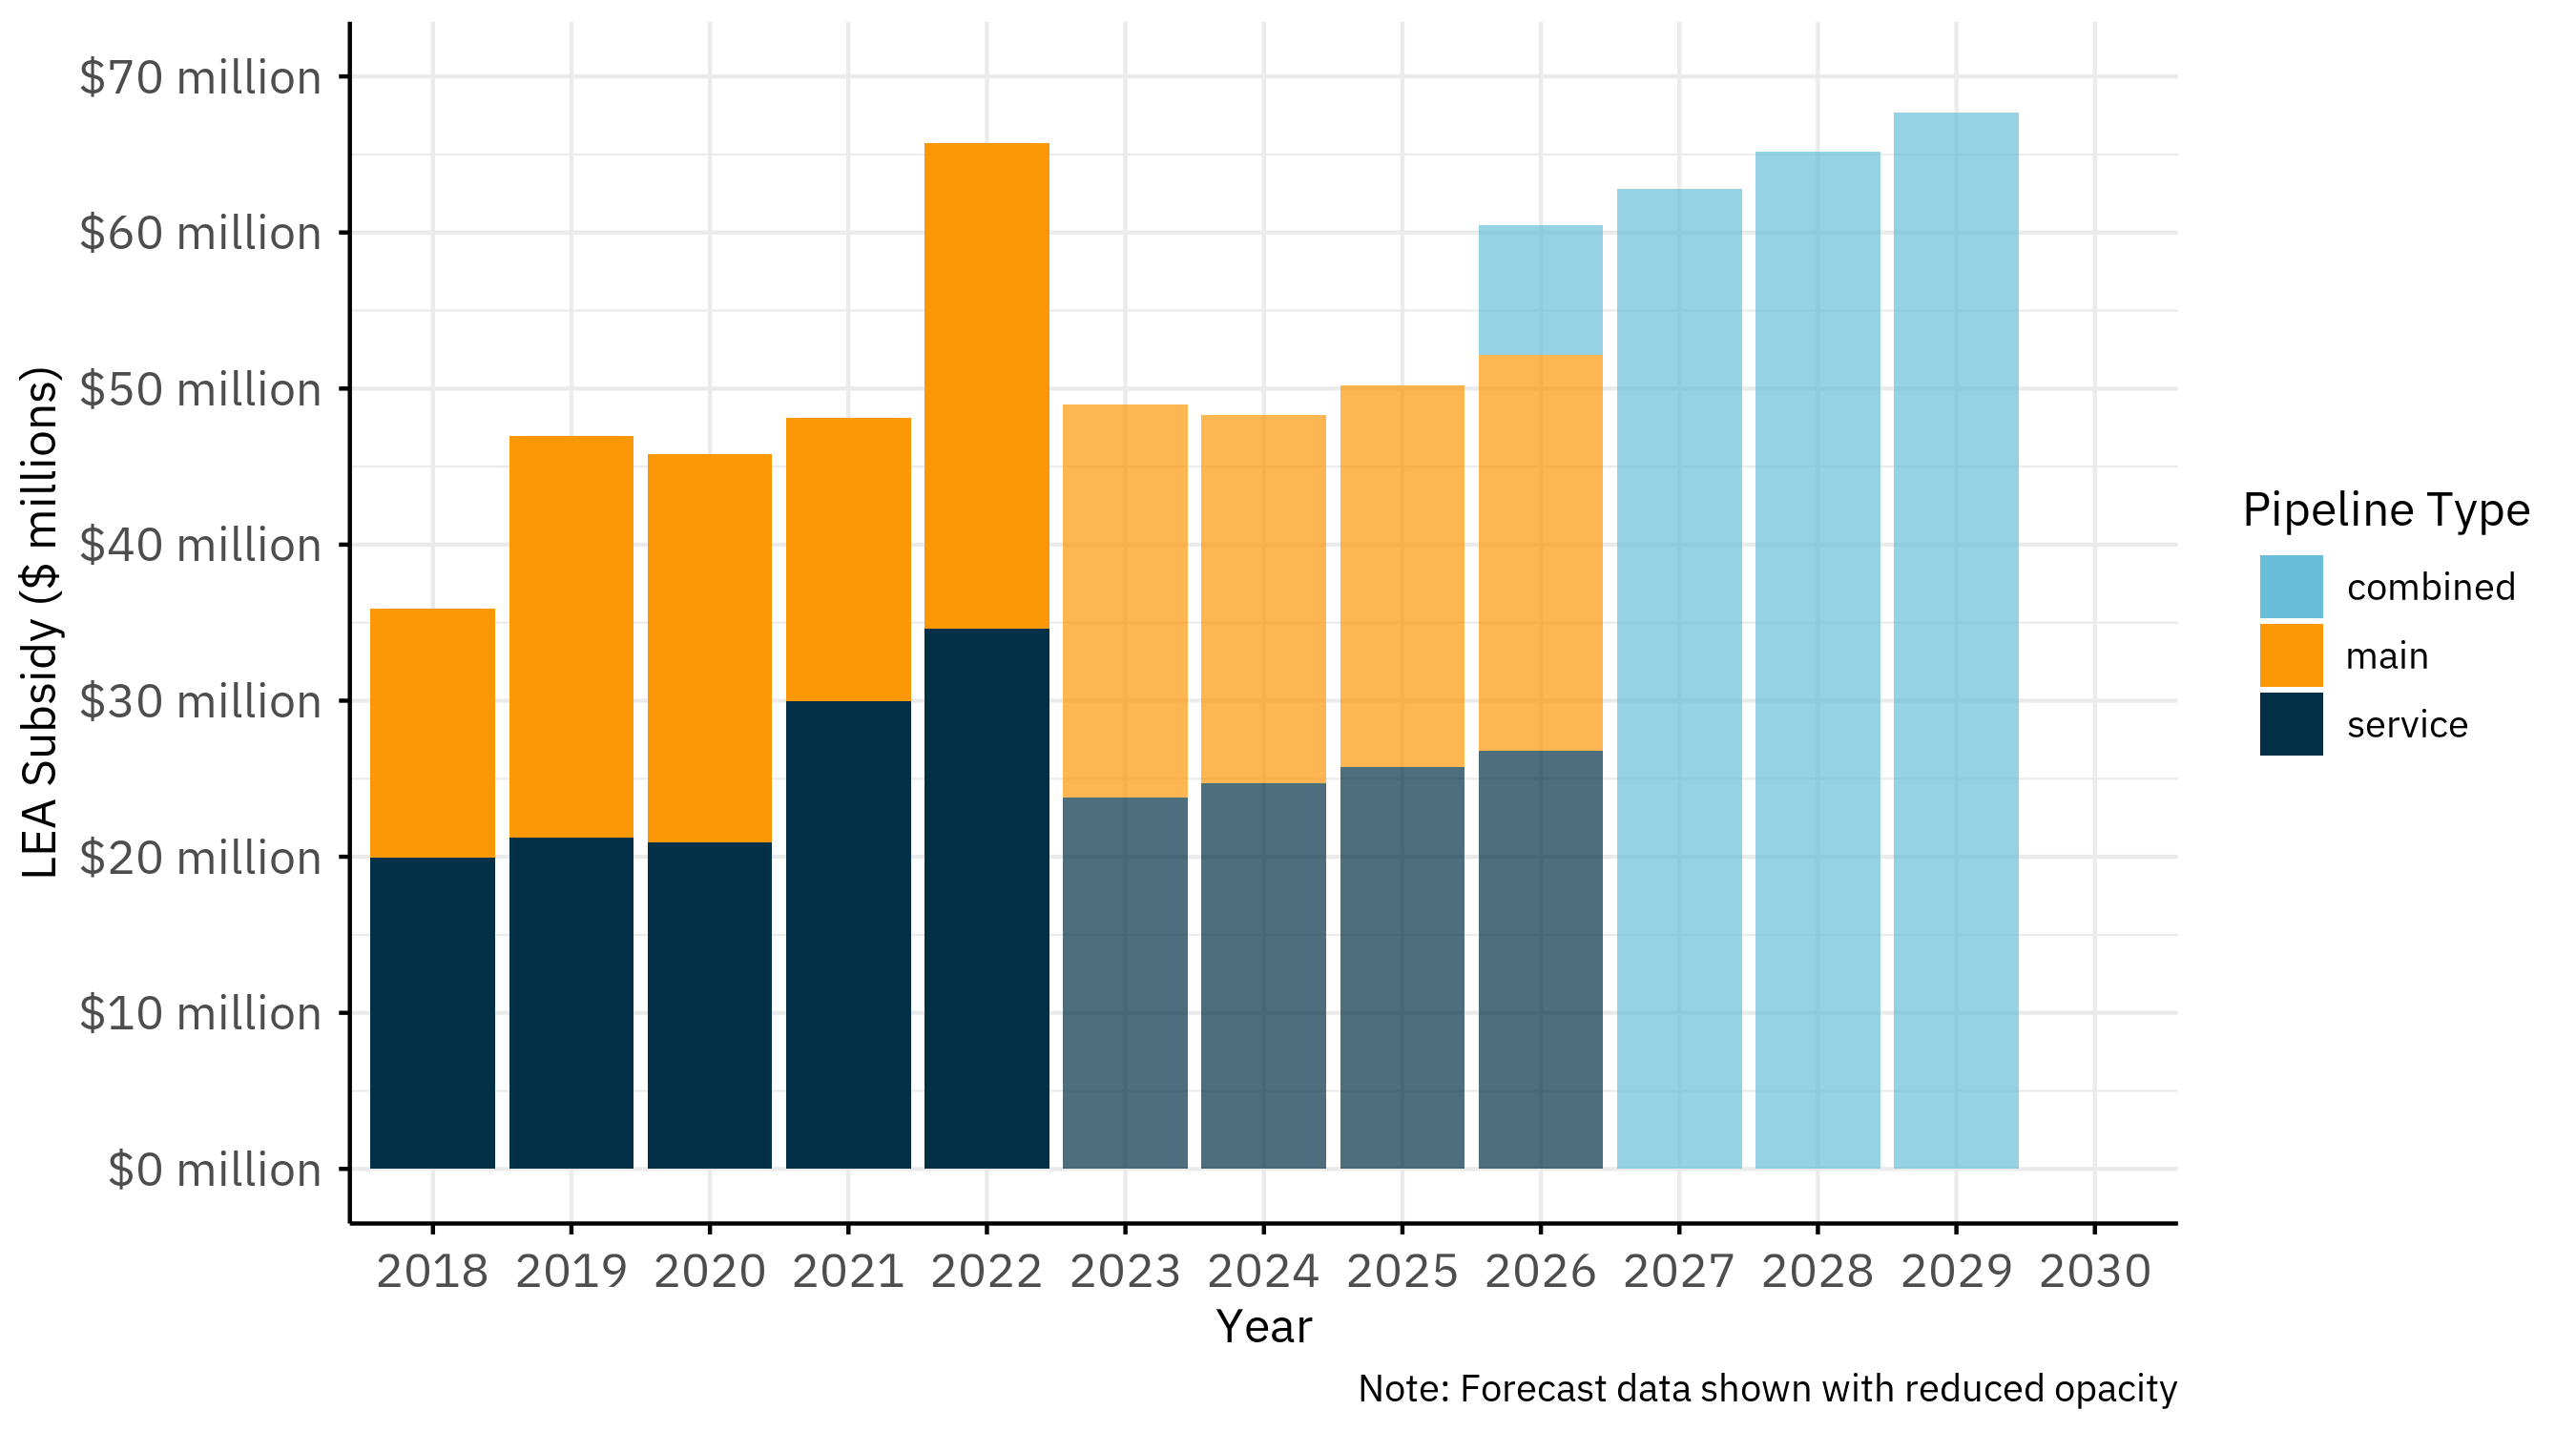
From 2018 to 2022, existing Nicor customers paid an average of $23.2 million per year to extend gas mains, and $25.3 million per year to build service lines for new customers (net of customer contributions).15
15 See ICC Docket 23-0066, PIO Exhibit 12. (Northern Illinois Gas Company 2023)
16 U.S. Department of Transportation, Pipeline and Hazardous Materials Safety Administration, Gas Distribution Annual Report (Form F7100.1-1), 2017–2025. (phmsa_GasDistributionAnnual_2025?)
And Nicor’s customer base is only getting bigger. US Department of Transportation data confirms Nicor is the only major Illinois gas utility which is consistently growing, adding roughly 5,000 to 7,000 net new service connections per year (from approximately 2.03 million in 2017 to 2.07 million in 2025). A bigger customer base means more new connections, and thus even bigger LEA spending.16
Both main extension and service line spending have grown in step with Nicor’s expanding customer base, and the utility’s own forecasts show that trajectory continuing through 2025 (Figure 2).
What does each Nicor connection cost?
Nicor’s language in its rate case filings makes it unclear how much it costs to connect each new customer to the gas network. What we can say is this:
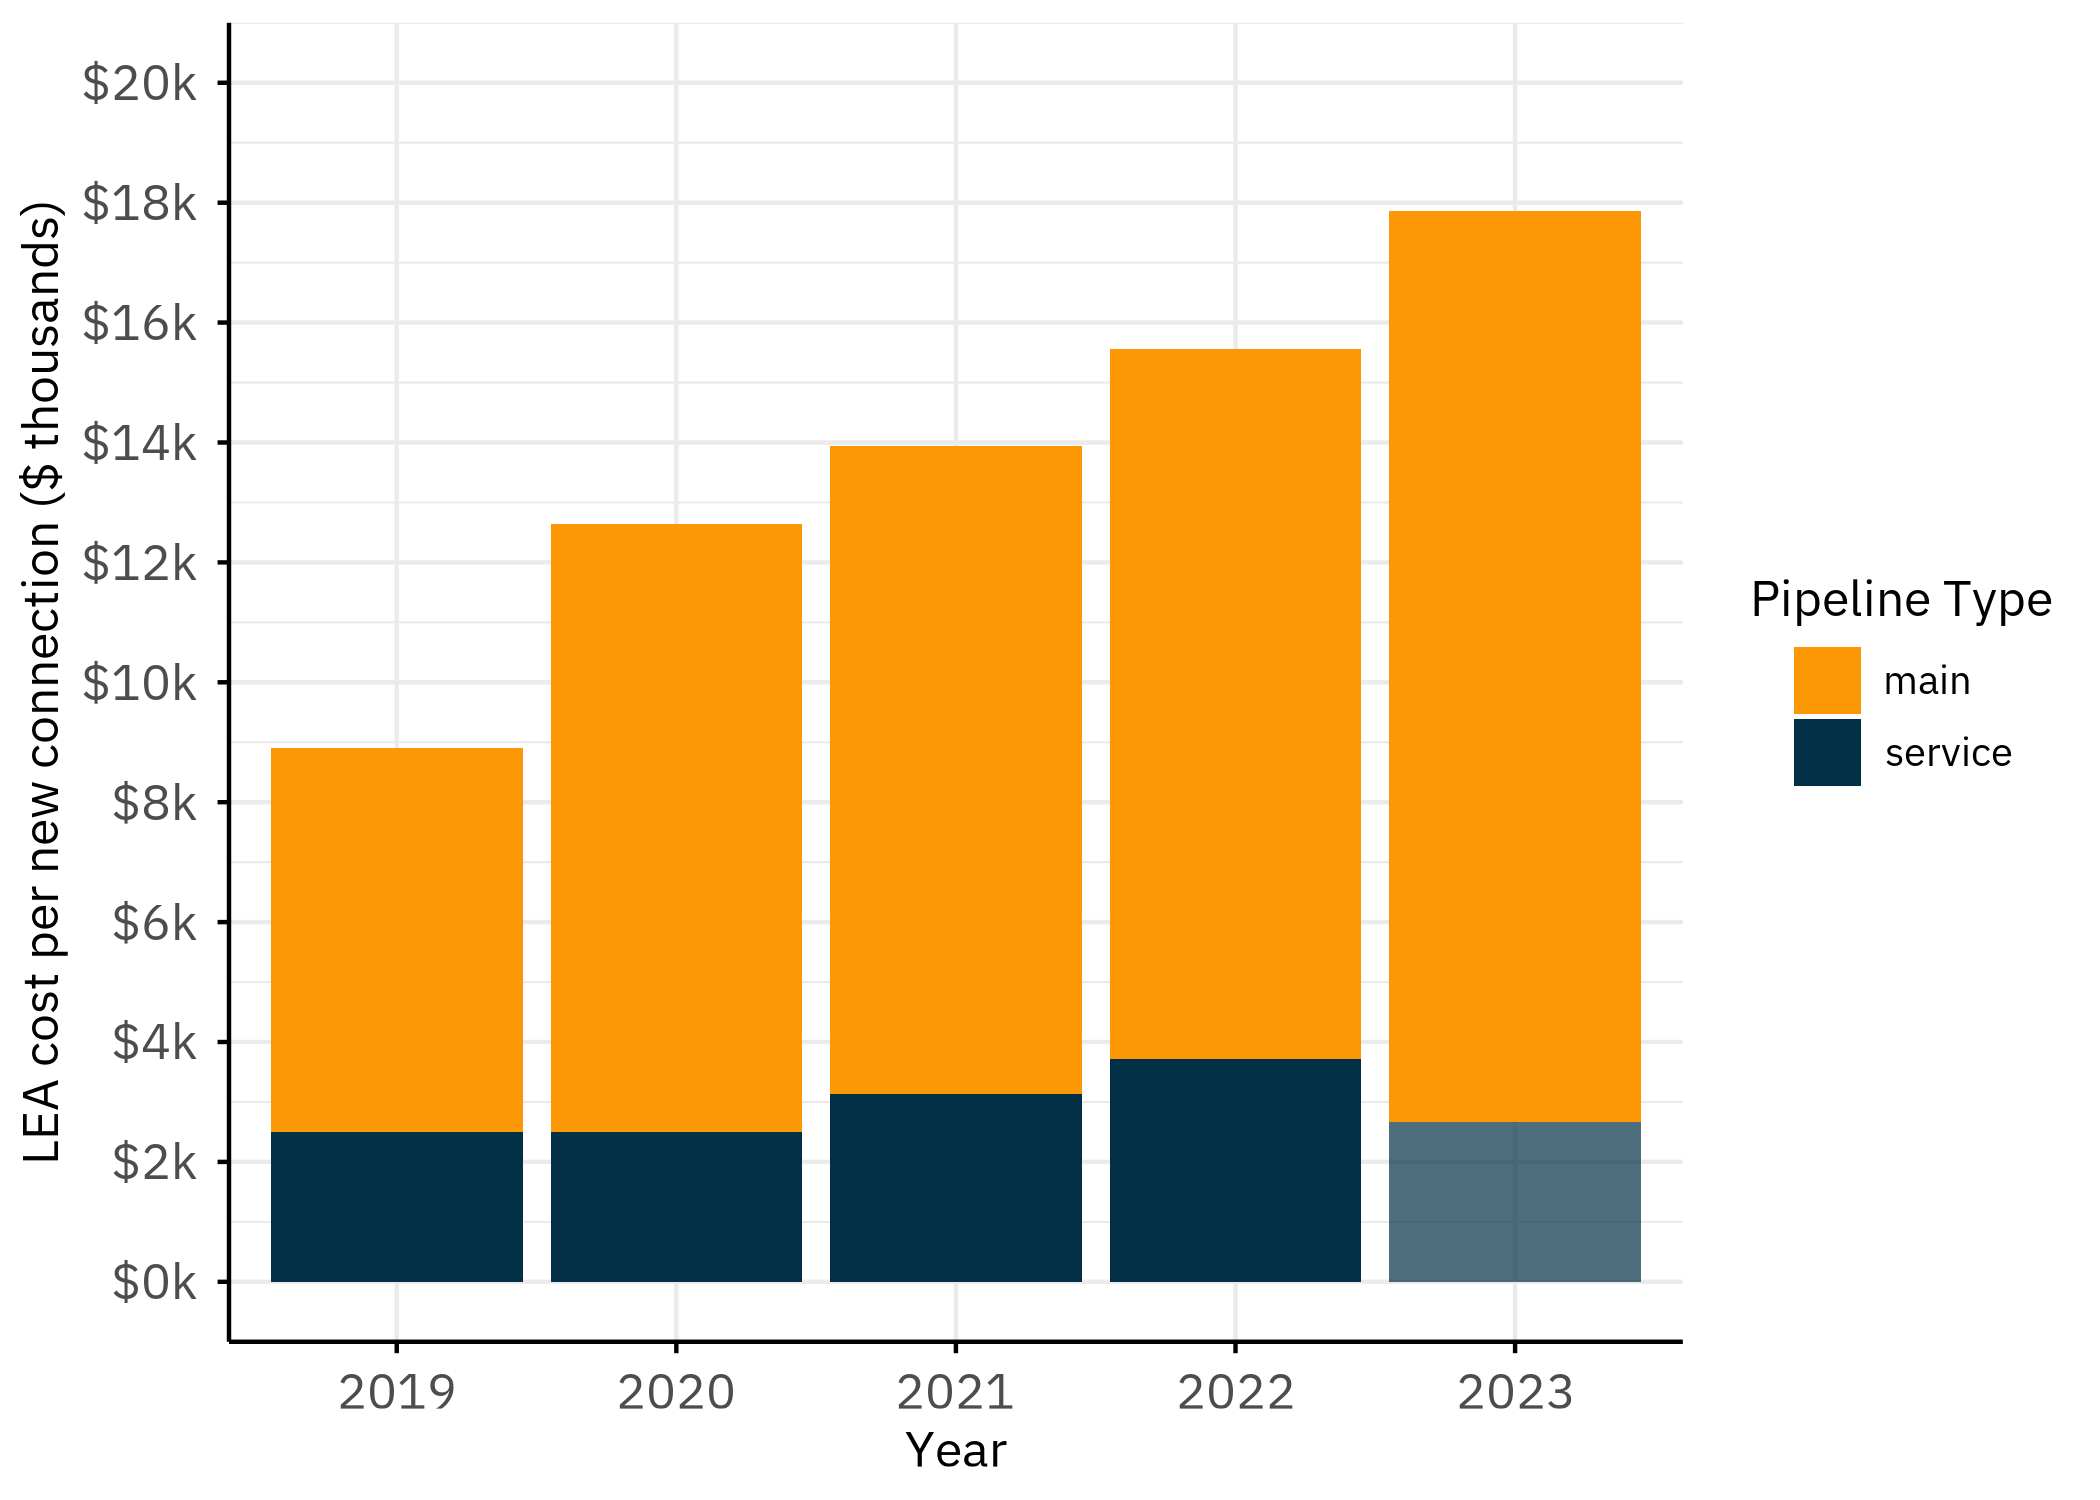
In 2023, Nicor spent an average of $15,202 in LEA subsidies per new main extension connection.17 The filings (and Nicor) do not clarify whether a “connection” refers to a building, a dwelling unit, or a gas meter. For instance, in a multi-family building, it is unclear whether each unit counts as a separate connection. We use the term as reported.
The average LEA subsidy per service line “project” was $3,716 in 2022.18 Nicor does not actually report a cost per service line connection, so we calculated the figure based on total service line extension cost divided by the number of service line projects. Again, we interpret one project as one connection, as Nicor does not specifically define the term.
17 Reported as lea_cost_per_customer for high-pressure mains. ICC Docket 23-0066, PIO Exhibit 12, p. 31. (Northern Illinois Gas Company 2023)
18 Calculated as net service line spending ($34,624,181) ÷ number of service line projects (9,318). ICC Docket 23-0066, PIO Exhibit 12, p. 33 (costs), p. 35 (project counts). (Northern Illinois Gas Company 2023)
19 Per-foot costs for high-pressure mains. ICC Docket 23-0066, PIO Exhibit 12, p. 31. (Northern Illinois Gas Company 2023)
These costs are growing. The average cost per connection for a main extension more than doubled from $6,412 in 2019 to the $15,202 it cost in 2023. Main line extensions also got more expensive per foot, rising more than 100%, from $32.06 to $76.01, over the same period.19
The chart below traces this escalation for both main extensions and service lines, showing how rapidly the cost of each new Nicor connection has grown since 2019 (Figure 3).
How much does Peoples Gas spend on LEAs?
From 2018 to 2022, Peoples Gas customers paid an average of $5.6 million per year to extend gas mains and $15.5 million per year to build service lines for new customers. That’s $21.1 million per year.
And while Peoples forecasted that it would decrease its spending on main extensions from $5.2 million in 2023 to $4.0 million in 2024, it simultaneously forecasted that it would increase spending on service line extensions from $17.2 million in 2023 to $18.5 million in 2024. 20
20 Peoples Gas main figures reported as “NonQIP main expenditures” net of customer contributions. Historical (2018–2022): ICC Docket 23-0068, PIO Exhibit 12, p. 36. Forecast (2023–2024): p. 39. Service line historical: p. 36, forecast: p. 40. (Peoples Gas 2023a)
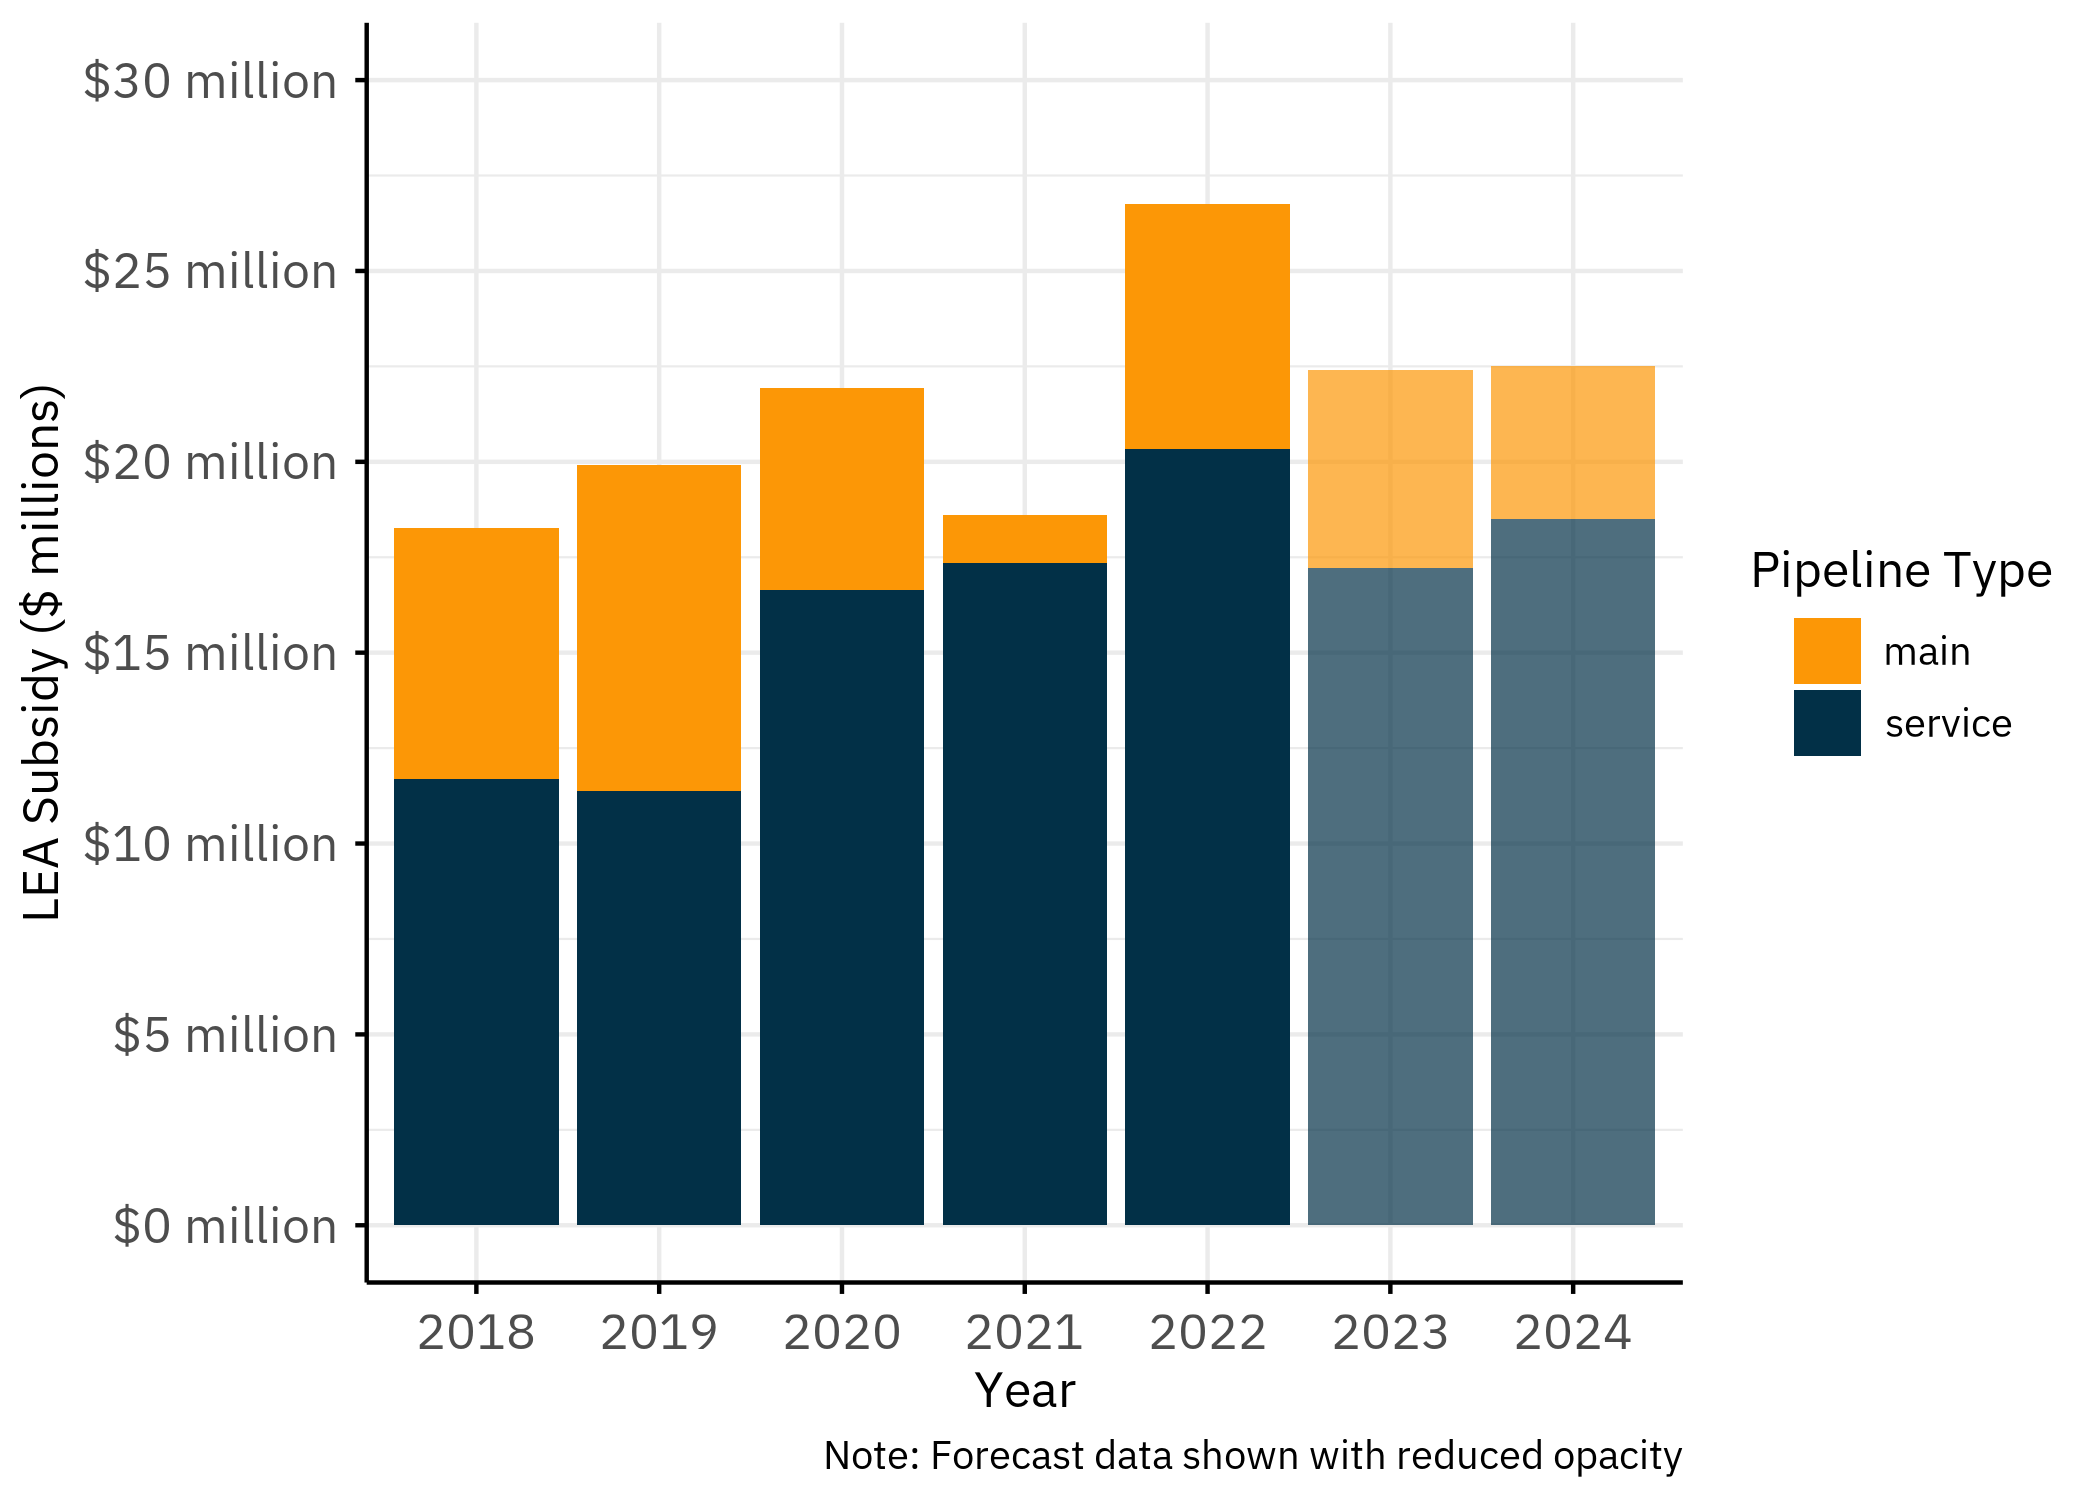
The chart shows service line spending sustained at over $15 million per year, even as main extension spending declines.
What does each Peoples Gas connection cost?
Peoples Gas also does not report a cost per connection for either main or service line extensions. However, information in its rate cases before the ICC tells us that in 2022, Peoples Gas customers paid an average of $11,784 to
extend gas mains and build service lines for each new single-family connection. This figure represents the average subsidized cost of connecting a single new residential single-family home to the distribution system, whether that’s done by a main or a service line. 21
21 Combined main and service line cost per new single-family residential connection. Multi-family costs not disclosed. ICC Docket 23-0069, PIO Cross-Exhibit 10.0, p. 1. (Peoples Gas 2023b)
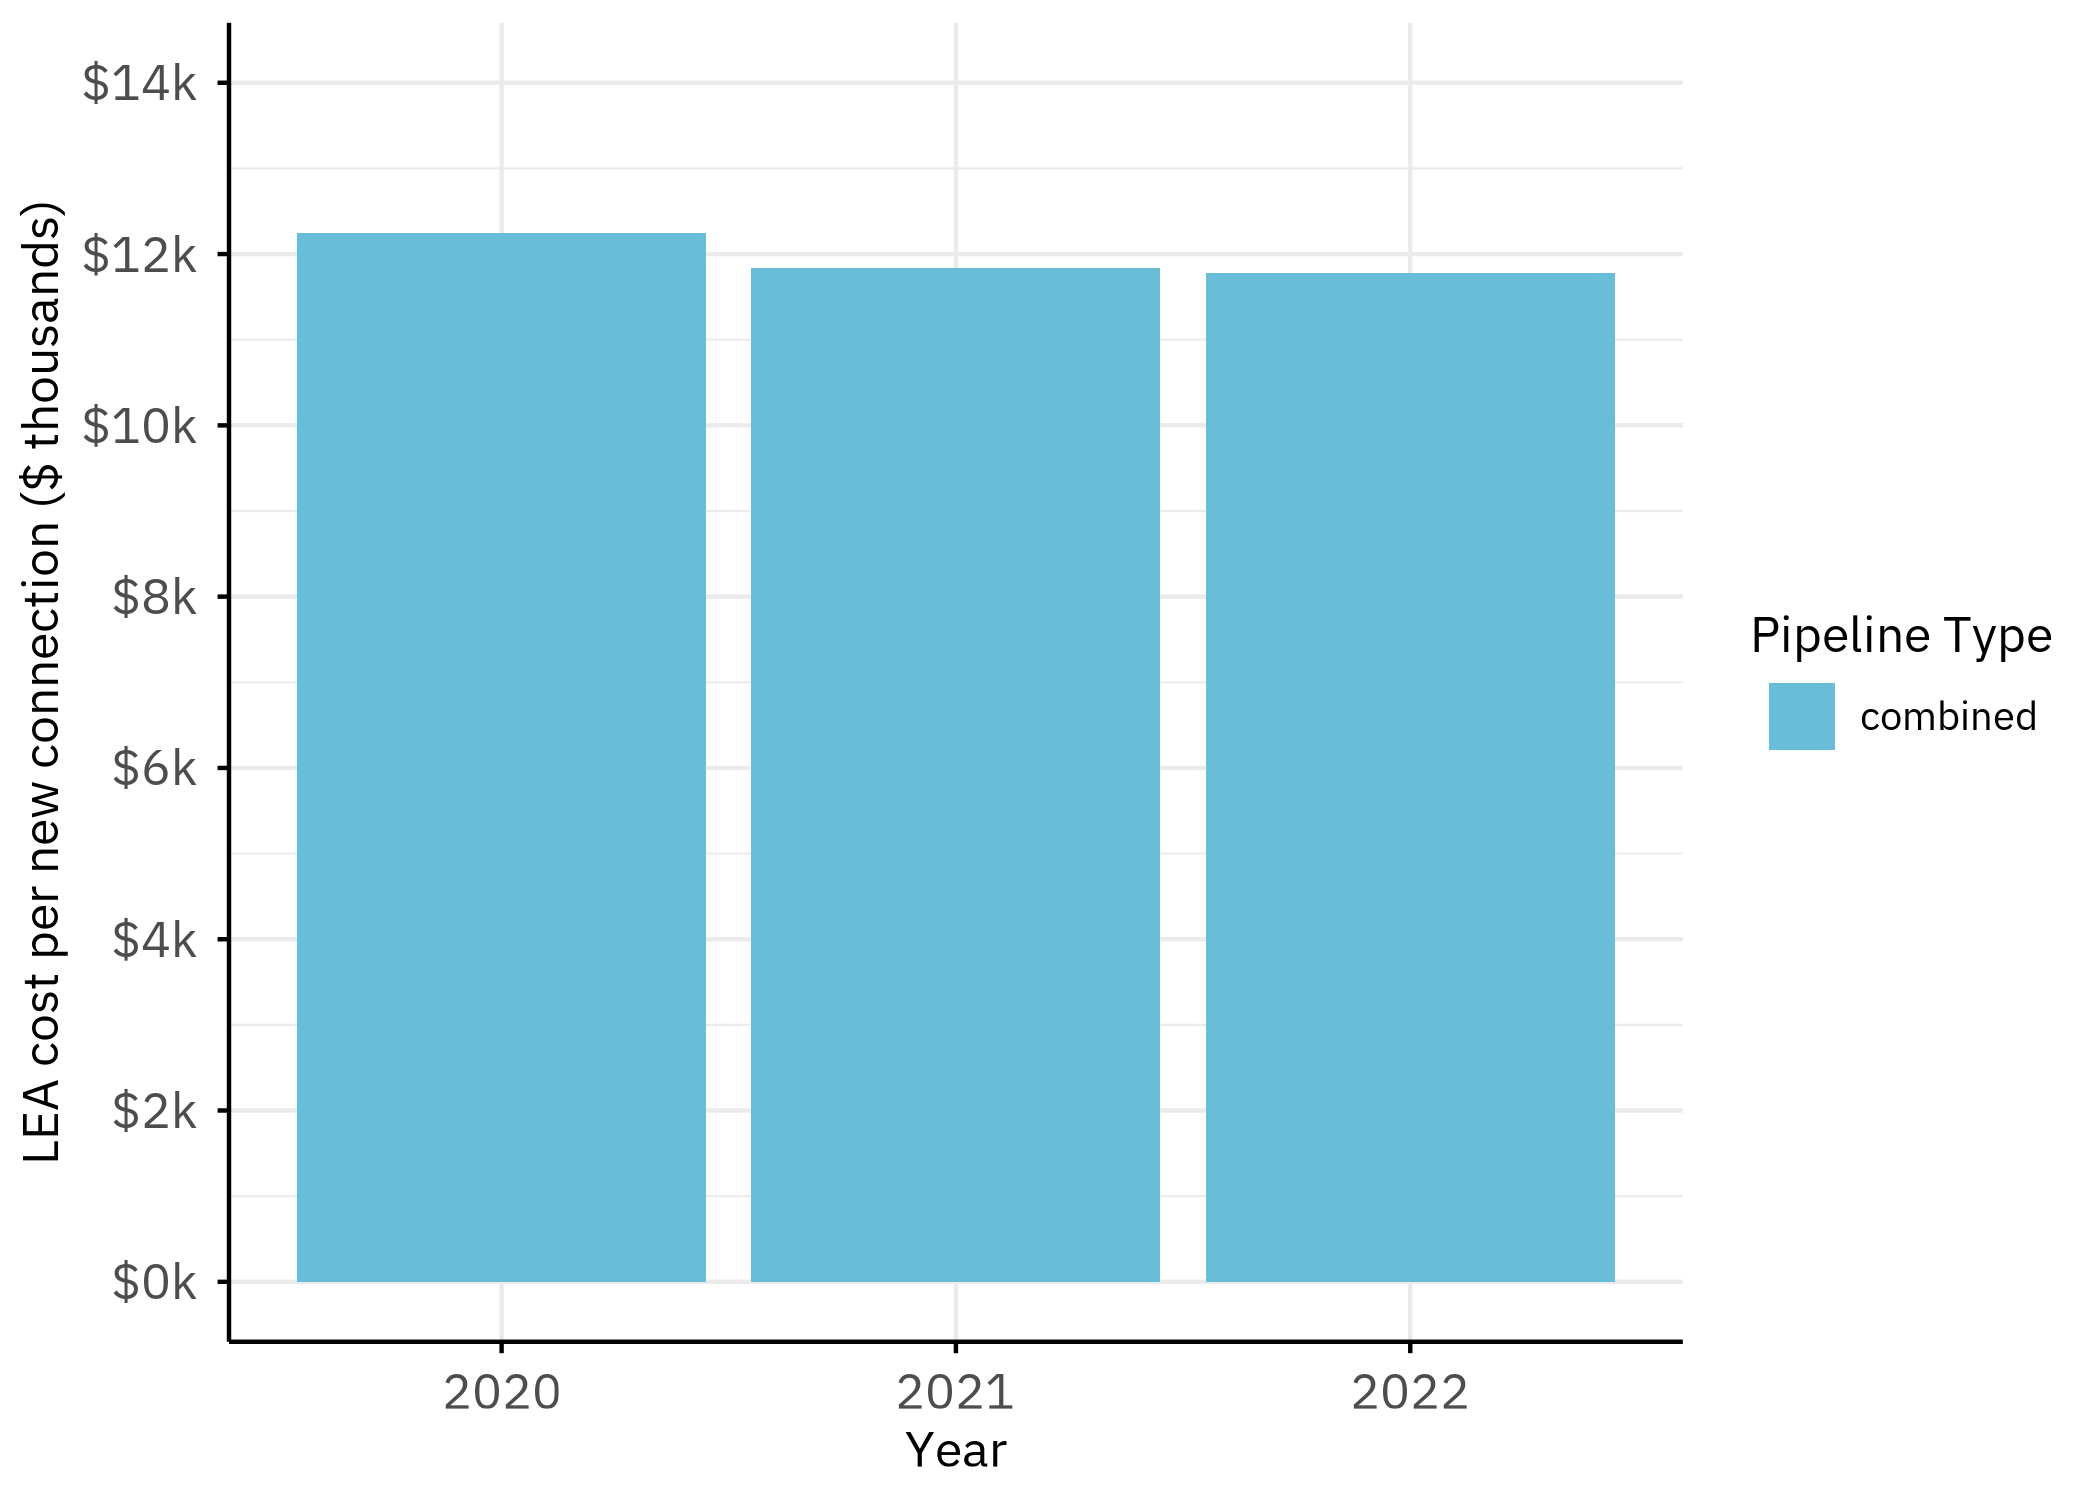
Peoples Gas’s per-connection cost has remained relatively stable over the period for which data is available, holding near $11,784 for single-family residential connections from 2020 through 2022.
How much does Ameren Gas spend on LEAs?
Ameren has denied requests to report directly on LEA spending. As an approximation, we use Ameren’s distribution standing work order (SWO) spending as a proxy for LEA costs.22
22 The SWO (internal code C3231) covers gas mains, service lines, fittings, and other materials associated with new service requests. A separate transmission SWO (C3160) is excluded as it covers large-scale equipment rather than new-customer connections. (Kilhoffer 2023)
23 Ameren SWO C3231 gross and CIAC. ICC Docket 23-0067, PIO Exhibit 12, p. 13 (2021–2022), p. 14 (2023–2024 forecast). Net figures: 2021 $21,486,023 − $1,355,566 = $20,130,457; 2022 $22,217,528 − $867,845 = $21,349,683. (Kilhoffer 2023)
Using SWO data from 2021, we estimate that Ameren spent $20.1 million using LEA subsidies that year. In 2022, that spending increased to $21.3 million.23
This spending is particularly notable because unlike Nicor and Peoples Gas, Ameren’s customer base is shrinking. US Department of Transportation data shows Ameren has lost approximately 1,000 to 2,000 service connections per year consistently since 2017. The total number of connections has declined from roughly 819,000 in 2017 to 809,000 in 2025.24
24 U.S. Department of Transportation, Pipeline and Hazardous Materials Safety Administration, Gas Distribution Annual Report (Form F7100.1-1), 2017–2025. (phmsa_GasDistributionAnnual_2025?)
In other words, Ameren’s ratepayers are likely funding more than $20 million annually of new infrastructure. That’s more spending for a pipeline network that serves fewer and fewer customers each year.
Ameren’s annual LEA spending rose steadily from 2021 through 2024 (Figure 6), even as its total service connections declined.
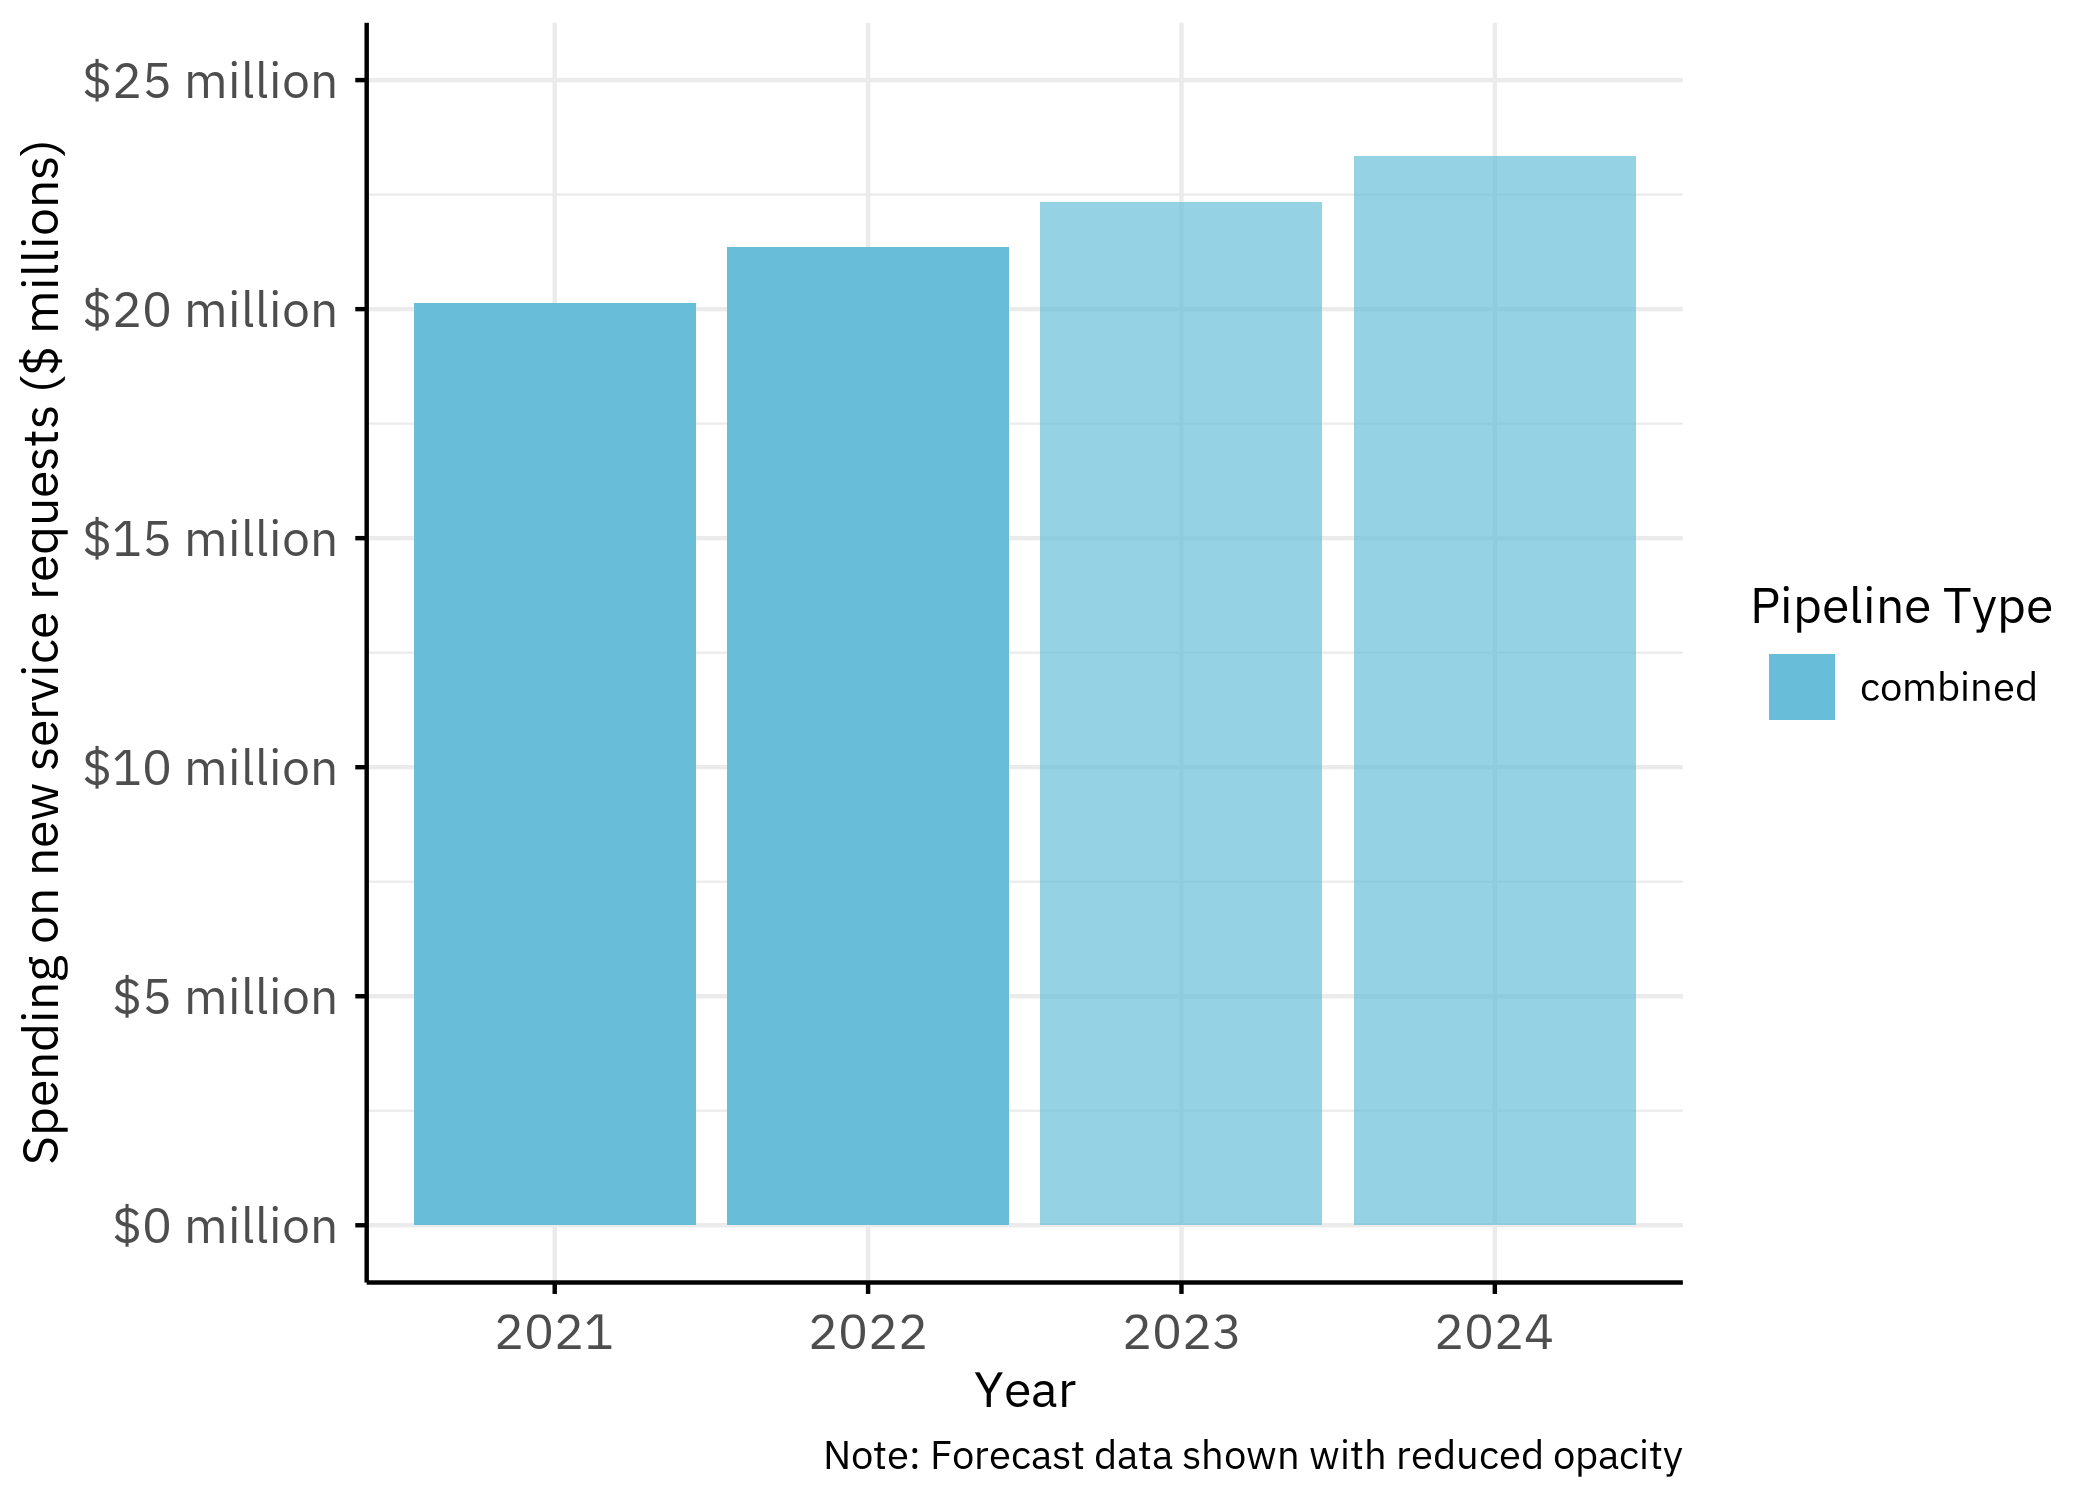
Even as Ameren’s customer base has shrunk by roughly 10,000 connections since 2017, its LEA spending has continued to rise — meaning each remaining customer is effectively subsidizing a larger share of new connection costs.
What does each Ameren connection cost?
Ameren reports an average standard cost equivalent per new connection. These figures cover main extensions only. Because they do not include service line extensions, they may also underestimate the true cost of connecting a new customer to Ameren’s network.
Our best estimate is that Ameren’s per connection cost rose from $5,539 in 2021 to $7,331 in 2025 (for main extensions only – service lines were not separately reported).
Why is LEA spending data so difficult to obtain?
No utility voluntarily published any of the data in this memo. Instead, we extracted it from discovery responses in ICC rate case filings.
Regrettably, even formal discovery procedures aren’t sufficient to give the public a complete picture of LEA spending. Utilities can object to requests for data on the grounds that isolating the information would require too much work. The legal term is “an objection on grounds of undue burden.” As a result, no utility reported a standardized LEA spending figure. Nicor provided the most detailed data, including per-connection costs, but no other utility replicated that level of disclosure. Peoples Gas does not track service line extension costs as a separate category, while Ameren has denied requests to report directly on LEA spending.
Appendix
Acknowledgments
The authors would like to thank:
- Bradley Cebulko, Current Energy Group
Data and Methods
Data collected from rate case filings
All source data used in this memo is available in consolidated form in our public input data spreadsheet, which links each figure to its original ICC filing.
LEA spending figures in this memo come from rate cases for the three major Illinois gas utilities. No utility voluntarily publishes this data.
Nicor Gas (ICC Rate Case 23-0066):
- Main extension spending: Reported as
extension_costby year (2018–2022 historical, 2023–2026 forecast), net of Contributions in Aid of Construction (CIAC) which Nicor reports separately ascustomer_contribution. Figures in this memo reflect the net amount (gross minus CIAC). - Service line spending: Same structure as main extensions, with separate CIAC figures for service lines.
- Per-connection main extension cost: Reported directly by Nicor as
lea_cost_per_customer(2019–2023). Nicor is the only utility in our sample that reports a standardized per-connection figure. - Service line per-project cost: Not directly reported. We calculate it as total service line extension cost (net of CIAC) divided by the number of service line projects (
n_projects). We interpret one project as one connection. - Per-foot main extension cost: Reported directly by Nicor for high-pressure mains (2019–2023).
Peoples Gas (ICC Rate Case 23-0068; ICC Rate Case 23-0069):
- Main extension spending: Reported as
lea_costby year (2018–2022 historical, 2023–2024 forecast). Peoples’ filing explicitly states main figures are “net of customer contributions.” - Service line spending: Reported as
lea_costby year with the same structure. Peoples does not separately disclose CIAC amounts for service lines. We therefore assume these figures are also net of customer contributions, consistent with the treatment of main extensions in the same filing. - Per-connection combined cost: Reported as
cost_per_new_service(2020–2022), covering single-family residential connections only. Multi-family connection costs were not disclosed. - Service line project counts: Reported for 2018–2022. Peoples does not forecast service line project counts, describing this work as customer-driven.
Ameren Illinois Gas (ICC Rate Case 23-0067; ICC Rate Case 25-0084):
- LEA spending: Ameren does not track LEA spending as a separate category. We use the distribution standing work order (SWO, internal code C3231) as the closest available proxy. Per Ameren’s filing, C3231 covers “gas mains, service lines, fittings and other material associated with new service requests.” Figures are reported as
distribution_extensions_total(gross) anddistribution_extensions_customer_contributions(CIAC). This memo uses net figures. A separate transmission SWO (C3160) is excluded as it covers large-scale equipment rather than new-customer connections. - Per-connection cost: Reported as the standard cost equivalent for 400 feet of main extension (
max_lea_cost_per_connect, 2021–2025). This covers main extensions only. Service line costs are not reported separately.
Data availability
The data available for each utility varies substantially in both completeness and comparability. Nicor Gas provides the most detailed disclosures, including per-connection costs for main extensions and separate CIAC figures for both mains and service lines. Peoples Gas provides total spending figures but does not isolate service line CIAC amounts, and does not forecast service line project counts. Ameren Illinois does not track LEA spending as a distinct category at all. The SWO C3231 figures used in this memo are the closest available proxy.
| Utility | Period |
Total Spending Allowance
|
Mains Allowance Spending
|
Services Allowance Spending
|
Projects Per Year
|
||||
|---|---|---|---|---|---|---|---|---|---|
| Mains Total | Services Total | Per Connection | Per Customer | Per Connection | Per Customer | Mains | Services | ||
| Nicor Gas | Historical | 2018-2022 | 2018-2022 | — | 2019-2023 | 2018-2022 | — | 2018-2022 | 2018-2022 |
| Nicor Gas | Forecast | 2023-2026 | 2023-2026 | — | — | 2023-2026 | — | 2023-2026 | 2023-2026 |
| Ameren Gas | Historical | 2021-2022 | 2021-2022 | 2021-2025 | — | — | — | — | — |
| Ameren Gas | Forecast | 2023-2024 | 2023-2025 | — | — | — | — | — | — |
| Peoples Gas | Historical | 2018-2022 | 2018-2022 | — | — | 2020-2022;2023 | 2020-2022 | 2018-2022 | 2018-2022 |
| Peoples Gas | Forecast | 2023-2024 | 2023-2024 | — | — | — | — | 2023-2024 | — |
| Green: Provided directly by utility | Yellow: Best estimate or calculated | Red: Not available | |||||||||
This inconsistency is itself a finding. Illinois ratepayers cannot make informed decisions about gas system expansion when the three utilities serving the state use three different accounting methods, and when one of them does not separately track LEA spending at all.
Estimated data
The following memo figures involve calculation or estimation beyond the raw values in utility filings:
- Nicor service line per-project cost ($3,716 in 2022). Calculated as net service line spending ($34,624,181) divided by the number of service line projects (9,318). Nicor does not directly report a cost-per-project figure for service lines.25
- Nicor main extension spending, net of CIAC. Calculated as
extension_cost+customer_contribution, where CIAC is stored as a negative value. Gross and net figures differ by approximately 3–8 percent in each year.26 - Peoples Gas service line spending, CIAC treatment. Peoples does not explicitly disclose whether its reported service line spending is gross or net of customer contributions. The same filing states that Peoples’ main extension figures are net of customer contributions. We assume the same treatment applies to service lines. If service line figures are instead gross, the actual ratepayer burden would be approximately 3–8 percent lower.27
- Ameren LEA spending. Estimated using the distribution SWO (C3231) net of CIAC. The SWO covers gas mains, service lines, fittings, and other materials associated with new service requests. This proxy may overstate LEA spending to the extent that C3231 includes costs beyond traditional line extensions. Conversely, it may understate LEA spending to the extent that relevant costs are charged to other work orders. Because Ameren does not track LEA spending as a separate category, no direct comparison is possible.28
- Statewide 2022 total ($113.8 million). Calculated as the sum of each utility’s 2022 net LEA spending: Nicor ($65.7M) + Peoples ($26.7M) + Ameren ($21.3M). All three figures are net of customer contributions.29
- PHMSA-derived connection counts. Statewide net growth (3,000–6,000 new connections per year), gross new installations (27,500–51,000 per year), and per-utility net change figures (Ameren: -1,000 to -2,000 per year & Nicor: +5,000 to +7,000 per year) are calculated from U.S. Department of Transportation Pipeline and Hazardous Materials Safety Administration Gas Distribution Annual Reports (Form F7100.1-1), 2017–2025. PHMSA data tracks all physical service line installations regardless of funding mechanism. It does not distinguish LEA-subsidized connections from customer-paid connections or from replacements of existing service lines. Gross installation counts from PHMSA are therefore not directly comparable to LEA-funded project counts from utility rate case filings.30
25 See ICC Docket 23-0066, PIO Exhibit 12. (Northern Illinois Gas Company 2023)
26 See ICC Docket 23-0066, PIO Exhibit 12. (Northern Illinois Gas Company 2023)
27 See ICC Docket 23-0068, PIO Exhibit 12. (Peoples Gas 2023a)
28 See ICC Docket 23-0067, PIO Exhibit 12. (Kilhoffer 2023)
29 See ICC Dockets 23-0066, 23-0068, and 23-0067. (Northern Illinois Gas Company 2023; Peoples Gas 2023a; Kilhoffer 2023)
30 U.S. Department of Transportation, Pipeline and Hazardous Materials Safety Administration, Gas Distribution Annual Report (Form F7100.1-1), 2017–2025. (phmsa_GasDistributionAnnual_2025?)
References
Reuse
Citation
@online{smith2026,
  author = {Smith, Alex},
  title = {Subsidizing {Gas} {System} {Expansion} in {Illinois}},
  date = {2026-04-21},
  langid = {en}
}